Caterpillar gives back its AI rally, down 48% since June
Why has Caterpillar stock fallen so much?
Caterpillar rose 86% this year to a June record as orders for data-center power equipment poured in, then fell 47.5%, leaving it about 2.5% down for 2026; Yahoo Finance linked the April rally to AI infrastructure demand and the Oct 29 and Nov 5 declines to selling in AI-related stocks, while Trefis linked the Oct 29 fall to an outlook that wasn't raised. On our calculation, about 7 points of the fall match the market and industrials, about 27 more other data-center power stocks, and about 13 go beyond them.
What it means
- What changed
- Backlog growth slowed to $6.0 billion in the third quarter from $9.4 billion in the second, and the outlook was kept, not raised.
- What hasn't changed
- Quarterly sales and the order backlog are at records, and Caterpillar still expects 2026 sales growth in the mid-to-high teens.
- Next · Late Jan 2027 (expected)
- Fourth-quarter results and Caterpillar's first word on 2027, which its CEO said would come in January.
- Move since Jun
- ▼ 47.5%
- Peak → now
- $1,064.90 → $558.63
- Value lost
- ~$232B
Prices: NYSE official close (Yahoo Finance, CNBC), Nov 6, 2026 · Company data: 10-Q, Sep 30, 2026 · What these numbers mean
NYSE closing prices per Yahoo Finance and CNBC; latest close Nov 6, 2026. Value change uses the 457.6 million shares Caterpillar reported outstanding on Sep 30, 2026, held constant.
Snapshot at the Nov 6, 2026 close
- Market value
- $255.6B
- Enterprise value
- $288.9B
- Price/sales
- 3.3×
- EV/sales
- 3.7×
- P/E
- 21.6×
- Price/FCF
- 26.6׆
- Revenue growth
- +20%
- FCF margin
- 12%†
- Net debt
- $33.3B
Our calculation from the company's filings (latest: 10-Q for the quarter to Sep 30, 2026, filed Nov 4, 2026); not investment advice. Revenue, earnings and cash flow: 12 months to Sep 30, 2026. Price $558.63 (NYSE official close (Yahoo Finance, CNBC)); 457.6 million shares (common shares on the cover page of the 10-Q filed Nov 4, 2026). n/m = not meaningful (e.g. negative earnings). † Free cash flow includes $4.3B of customer prepayments (increase in contract liabilities) in the 12 months to Sep 30, 2026. Cash and debt are both consolidated. Debt includes $34.6B at Cat Financial, mostly funding its loans to customers and dealers; Machinery, Power & Energy debt alone is $10.65B. Cash and investments include about $2.4B of securities held by Cat Financial and the insurance arm.
- : Q3 2025: AI lifts sales; record
- : Q1: record backlog; outlook raised
- : Record close, $1,064.90
- : Burry short disclosed; falls 6.9%
- : Q3: outlook kept; falls 9.3%
- : Midterms: falls 5.2% as S&P rises
Price data
| Date | Close |
|---|---|
| Apr 1, 2025 | $330.57 |
| Apr 2, 2025 | $334.66 |
| Apr 3, 2025 | $305.76 |
| Apr 4, 2025 | $288.08 |
| Apr 7, 2025 | $280.06 |
| Apr 8, 2025 | $273.94 |
| Apr 9, 2025 | $301.01 |
| Apr 10, 2025 | $289.16 |
| Apr 11, 2025 | $293.45 |
| Apr 14, 2025 | $298.12 |
| Apr 15, 2025 | $293.43 |
| Apr 16, 2025 | $290.14 |
| Apr 17, 2025 | $294.25 |
| Apr 21, 2025 | $284.74 |
| Apr 22, 2025 | $291.17 |
| Apr 23, 2025 | $295.77 |
| Apr 24, 2025 | $306.86 |
| Apr 25, 2025 | $306.45 |
| Apr 28, 2025 | $307.06 |
| Apr 29, 2025 | $307.40 |
| Apr 30, 2025 | $309.27 |
| May 1, 2025 | $313.96 |
| May 2, 2025 | $323.68 |
| May 5, 2025 | $323.11 |
| May 6, 2025 | $320.89 |
| May 7, 2025 | $320.29 |
| May 8, 2025 | $324.25 |
| May 9, 2025 | $325.62 |
| May 12, 2025 | $342.55 |
| May 13, 2025 | $352.54 |
| May 14, 2025 | $349.66 |
| May 15, 2025 | $349.81 |
| May 16, 2025 | $353.58 |
| May 19, 2025 | $352.57 |
| May 20, 2025 | $349.49 |
| May 21, 2025 | $342.51 |
| May 22, 2025 | $345.19 |
| May 23, 2025 | $343.39 |
| May 27, 2025 | $351.51 |
| May 28, 2025 | $349.49 |
| May 29, 2025 | $351.79 |
| May 30, 2025 | $348.03 |
| Jun 2, 2025 | $344.67 |
| Jun 3, 2025 | $349.40 |
| Jun 4, 2025 | $349.33 |
| Jun 5, 2025 | $348.96 |
| Jun 6, 2025 | $353.35 |
| Jun 9, 2025 | $358.07 |
| Jun 10, 2025 | $358.57 |
| Jun 11, 2025 | $363.14 |
| Jun 12, 2025 | $360.96 |
| Jun 13, 2025 | $357.05 |
| Jun 16, 2025 | $362.44 |
| Jun 17, 2025 | $357.68 |
| Jun 18, 2025 | $359.80 |
| Jun 20, 2025 | $360.52 |
| Jun 23, 2025 | $366.23 |
| Jun 24, 2025 | $373.02 |
| Jun 25, 2025 | $371.58 |
| Jun 26, 2025 | $381.88 |
| Jun 27, 2025 | $384.71 |
| Jun 30, 2025 | $388.21 |
| Jul 1, 2025 | $390.92 |
| Jul 2, 2025 | $398.43 |
| Jul 3, 2025 | $397.86 |
| Jul 7, 2025 | $391.51 |
| Jul 8, 2025 | $394.29 |
| Jul 9, 2025 | $402.18 |
| Jul 10, 2025 | $408.33 |
| Jul 11, 2025 | $405.92 |
| Jul 14, 2025 | $405.77 |
| Jul 15, 2025 | $404.64 |
| Jul 16, 2025 | $412.88 |
| Jul 17, 2025 | $418.07 |
| Jul 18, 2025 | $413.71 |
| Jul 21, 2025 | $410.07 |
| Jul 22, 2025 | $417.19 |
| Jul 23, 2025 | $427.59 |
| Jul 24, 2025 | $429.52 |
| Jul 25, 2025 | $433.75 |
| Jul 28, 2025 | $432.94 |
| Jul 29, 2025 | $430.05 |
| Jul 30, 2025 | $434.12 |
| Jul 31, 2025 | $438.02 |
| Aug 1, 2025 | $428.69 |
| Aug 4, 2025 | $433.70 |
| Aug 5, 2025 | $434.23 |
| Aug 6, 2025 | $427.72 |
| Aug 7, 2025 | $417.12 |
| Aug 8, 2025 | $416.52 |
| Aug 11, 2025 | $408.54 |
| Aug 12, 2025 | $412.71 |
| Aug 13, 2025 | $413.70 |
| Aug 14, 2025 | $417.50 |
| Aug 15, 2025 | $407.79 |
| Aug 18, 2025 | $412.64 |
| Aug 19, 2025 | $416.09 |
| Aug 20, 2025 | $420.59 |
| Aug 21, 2025 | $417.89 |
| Aug 22, 2025 | $435.67 |
| Aug 25, 2025 | $432.30 |
| Aug 26, 2025 | $431.26 |
| Aug 27, 2025 | $432.67 |
| Aug 28, 2025 | $434.91 |
| Aug 29, 2025 | $419.04 |
| Sep 2, 2025 | $416.05 |
| Sep 3, 2025 | $415.12 |
| Sep 4, 2025 | $420.22 |
| Sep 5, 2025 | $423.08 |
| Sep 8, 2025 | $422.78 |
| Sep 9, 2025 | $418.09 |
| Sep 10, 2025 | $422.91 |
| Sep 11, 2025 | $431.38 |
| Sep 12, 2025 | $431.52 |
| Sep 15, 2025 | $435.94 |
| Sep 16, 2025 | $440.67 |
| Sep 17, 2025 | $450.66 |
| Sep 18, 2025 | $466.96 |
| Sep 19, 2025 | $466.54 |
| Sep 22, 2025 | $472.10 |
| Sep 23, 2025 | $471.26 |
| Sep 24, 2025 | $469.79 |
| Sep 25, 2025 | $463.72 |
| Sep 26, 2025 | $465.76 |
| Sep 29, 2025 | $471.61 |
| Sep 30, 2025 | $477.15 |
| Oct 1, 2025 | $480.82 |
| Oct 2, 2025 | $490.57 |
| Oct 3, 2025 | $497.85 |
| Oct 6, 2025 | $495.38 |
| Oct 7, 2025 | $486.71 |
| Oct 8, 2025 | $502.12 |
| Oct 9, 2025 | $500.36 |
| Oct 10, 2025 | $491.30 |
| Oct 13, 2025 | $504.76 |
| Oct 14, 2025 | $527.47 |
| Oct 15, 2025 | $534.05 |
| Oct 16, 2025 | $540.96 |
| Oct 17, 2025 | $527.08 |
| Oct 20, 2025 | $531.18 |
| Oct 21, 2025 | $524.65 |
| Oct 22, 2025 | $513.91 |
| Oct 23, 2025 | $520.50 |
| Oct 24, 2025 | $522.73 |
| Oct 27, 2025 | $527.07 |
| Oct 28, 2025 | $524.47 |
| Oct 29, 2025 | $585.49 |
| Oct 30, 2025 | $583.15 |
| Oct 31, 2025 | $577.26 |
| Nov 3, 2025 | $570.59 |
| Nov 4, 2025 | $547.58 |
| Nov 5, 2025 | $569.15 |
| Nov 6, 2025 | $569.78 |
| Nov 7, 2025 | $563.10 |
| Nov 10, 2025 | $570.85 |
| Nov 11, 2025 | $567.93 |
| Nov 12, 2025 | $573.02 |
| Nov 13, 2025 | $553.55 |
| Nov 14, 2025 | $554.03 |
| Nov 17, 2025 | $552.05 |
| Nov 18, 2025 | $546.88 |
| Nov 19, 2025 | $553.11 |
| Nov 20, 2025 | $546.13 |
| Nov 21, 2025 | $550.43 |
| Nov 24, 2025 | $559.60 |
| Nov 25, 2025 | $566.61 |
| Nov 26, 2025 | $573.73 |
| Nov 28, 2025 | $575.76 |
| Dec 1, 2025 | $568.06 |
| Dec 2, 2025 | $582.47 |
| Dec 3, 2025 | $591.49 |
| Dec 4, 2025 | $599.15 |
| Dec 5, 2025 | $603.17 |
| Dec 8, 2025 | $596.50 |
| Dec 9, 2025 | $594.36 |
| Dec 10, 2025 | $615.35 |
| Dec 11, 2025 | $625.61 |
| Dec 12, 2025 | $597.89 |
| Dec 15, 2025 | $589.76 |
| Dec 16, 2025 | $588.93 |
| Dec 17, 2025 | $561.89 |
| Dec 18, 2025 | $565.83 |
| Dec 19, 2025 | $576.22 |
| Dec 22, 2025 | $582.41 |
| Dec 23, 2025 | $582.42 |
| Dec 24, 2025 | $583.76 |
| Dec 26, 2025 | $583.00 |
| Dec 29, 2025 | $578.61 |
| Dec 30, 2025 | $577.39 |
| Dec 31, 2025 | $572.87 |
| Jan 2, 2026 | $598.41 |
| Jan 5, 2026 | $616.10 |
| Jan 6, 2026 | $623.09 |
| Jan 7, 2026 | $596.52 |
| Jan 8, 2026 | $608.13 |
| Jan 9, 2026 | $617.62 |
| Jan 12, 2026 | $629.77 |
| Jan 13, 2026 | $636.53 |
| Jan 14, 2026 | $638.75 |
| Jan 15, 2026 | $647.18 |
| Jan 16, 2026 | $646.89 |
| Jan 20, 2026 | $629.00 |
| Jan 21, 2026 | $645.38 |
| Jan 22, 2026 | $648.41 |
| Jan 23, 2026 | $626.62 |
| Jan 26, 2026 | $635.92 |
| Jan 27, 2026 | $638.91 |
| Jan 28, 2026 | $643.28 |
| Jan 29, 2026 | $665.24 |
| Jan 30, 2026 | $657.36 |
| Feb 2, 2026 | $690.91 |
| Feb 3, 2026 | $702.89 |
| Feb 4, 2026 | $691.82 |
| Feb 5, 2026 | $678.31 |
| Feb 6, 2026 | $726.20 |
| Feb 9, 2026 | $742.12 |
| Feb 10, 2026 | $742.37 |
| Feb 11, 2026 | $775.00 |
| Feb 12, 2026 | $758.29 |
| Feb 13, 2026 | $774.20 |
| Feb 17, 2026 | $764.76 |
| Feb 18, 2026 | $751.97 |
| Feb 19, 2026 | $760.53 |
| Feb 20, 2026 | $759.74 |
| Feb 23, 2026 | $756.47 |
| Feb 24, 2026 | $768.23 |
| Feb 25, 2026 | $766.61 |
| Feb 26, 2026 | $752.93 |
| Feb 27, 2026 | $742.83 |
| Mar 2, 2026 | $752.32 |
| Mar 3, 2026 | $722.18 |
| Mar 4, 2026 | $731.97 |
| Mar 5, 2026 | $706.08 |
| Mar 6, 2026 | $680.90 |
| Mar 9, 2026 | $704.82 |
| Mar 10, 2026 | $716.68 |
| Mar 11, 2026 | $707.59 |
| Mar 12, 2026 | $700.69 |
| Mar 13, 2026 | $693.99 |
| Mar 16, 2026 | $699.78 |
| Mar 17, 2026 | $702.00 |
| Mar 18, 2026 | $693.62 |
| Mar 19, 2026 | $688.65 |
| Mar 20, 2026 | $680.88 |
| Mar 23, 2026 | $701.70 |
| Mar 24, 2026 | $716.63 |
| Mar 25, 2026 | $719.04 |
| Mar 26, 2026 | $703.19 |
| Mar 27, 2026 | $695.40 |
| Mar 30, 2026 | $667.43 |
| Mar 31, 2026 | $708.46 |
| Apr 1, 2026 | $730.32 |
| Apr 2, 2026 | $717.22 |
| Apr 6, 2026 | $721.24 |
| Apr 7, 2026 | $724.44 |
| Apr 8, 2026 | $771.58 |
| Apr 9, 2026 | $787.07 |
| Apr 10, 2026 | $790.66 |
| Apr 13, 2026 | $791.73 |
| Apr 14, 2026 | $794.25 |
| Apr 15, 2026 | $770.17 |
| Apr 16, 2026 | $772.66 |
| Apr 17, 2026 | $794.65 |
| Apr 20, 2026 | $798.40 |
| Apr 21, 2026 | $800.45 |
| Apr 22, 2026 | $808.87 |
| Apr 23, 2026 | $835.24 |
| Apr 24, 2026 | $830.79 |
| Apr 27, 2026 | $828.79 |
| Apr 28, 2026 | $817.87 |
| Apr 29, 2026 | $810.05 |
| Apr 30, 2026 | $890.11 |
| May 1, 2026 | $889.67 |
| May 4, 2026 | $874.78 |
| May 5, 2026 | $904.59 |
| May 6, 2026 | $926.93 |
| May 7, 2026 | $895.69 |
| May 8, 2026 | $897.45 |
| May 11, 2026 | $926.79 |
| May 12, 2026 | $912.14 |
| May 13, 2026 | $902.30 |
| May 14, 2026 | $920.22 |
| May 15, 2026 | $888.31 |
| May 18, 2026 | $863.95 |
| May 19, 2026 | $860.15 |
| May 20, 2026 | $872.56 |
| May 21, 2026 | $865.95 |
| May 22, 2026 | $879.89 |
| May 26, 2026 | $908.55 |
| May 27, 2026 | $909.93 |
| May 28, 2026 | $887.67 |
| May 29, 2026 | $875.87 |
| Jun 1, 2026 | $865.36 |
| Jun 2, 2026 | $909.81 |
| Jun 3, 2026 | $926.18 |
| Jun 4, 2026 | $940.48 |
| Jun 5, 2026 | $904.28 |
| Jun 8, 2026 | $915.64 |
| Jun 9, 2026 | $914.70 |
| Jun 10, 2026 | $856.16 |
| Jun 11, 2026 | $897.63 |
| Jun 12, 2026 | $910.57 |
| Jun 15, 2026 | $933.93 |
| Jun 16, 2026 | $945.46 |
| Jun 17, 2026 | $955.92 |
| Jun 18, 2026 | $985.82 |
| Jun 22, 2026 | $1,022.28 |
| Jun 23, 2026 | $984.24 |
| Jun 24, 2026 | $994.45 |
| Jun 25, 2026 | $1,057.01 |
| Jun 26, 2026 | $997.47 |
| Jun 29, 2026 | $1,033.19 |
| Jun 30, 2026 | $1,064.90 |
| Jul 1, 2026 | $991.41 |
| Jul 2, 2026 | $963.53 |
| Jul 6, 2026 | $969.92 |
| Jul 7, 2026 | $940.12 |
| Jul 8, 2026 | $948.08 |
| Jul 9, 2026 | $938.39 |
| Jul 10, 2026 | $952.41 |
| Jul 13, 2026 | $931.47 |
| Jul 14, 2026 | $933.34 |
| Jul 15, 2026 | $914.30 |
| Jul 16, 2026 | $877.17 |
| Jul 17, 2026 | $880.28 |
| Jul 20, 2026 | $864.30 |
| Jul 21, 2026 | $889.97 |
| Jul 22, 2026 | $889.31 |
| Jul 23, 2026 | $894.54 |
| Jul 24, 2026 | $888.73 |
| Jul 27, 2026 | $873.28 |
| Jul 28, 2026 | $840.85 |
| Jul 29, 2026 | $782.71 |
| Jul 30, 2026 | $809.14 |
| Jul 31, 2026 | $814.81 |
| Aug 3, 2026 | $830.03 |
| Aug 4, 2026 | $876.54 |
| Aug 5, 2026 | $871.08 |
| Aug 6, 2026 | $856.96 |
| Aug 7, 2026 | $842.19 |
| Aug 10, 2026 | $837.58 |
| Aug 11, 2026 | $843.37 |
| Aug 12, 2026 | $855.60 |
| Aug 13, 2026 | $854.60 |
| Aug 14, 2026 | $856.57 |
| Aug 17, 2026 | $881.65 |
| Aug 18, 2026 | $840.87 |
| Aug 19, 2026 | $816.15 |
| Aug 20, 2026 | $815.39 |
| Aug 21, 2026 | $827.90 |
| Aug 24, 2026 | $811.02 |
| Aug 25, 2026 | $811.29 |
| Aug 26, 2026 | $821.93 |
| Aug 27, 2026 | $817.00 |
| Aug 28, 2026 | $800.25 |
| Aug 31, 2026 | $797.47 |
| Sep 1, 2026 | $779.16 |
| Sep 2, 2026 | $792.28 |
| Sep 3, 2026 | $800.14 |
| Sep 4, 2026 | $813.94 |
| Sep 8, 2026 | $822.48 |
| Sep 9, 2026 | $815.56 |
| Sep 10, 2026 | $805.00 |
| Sep 11, 2026 | $818.57 |
| Sep 14, 2026 | $784.00 |
| Sep 15, 2026 | $783.54 |
| Sep 16, 2026 | $782.72 |
| Sep 17, 2026 | $798.57 |
| Sep 18, 2026 | $808.99 |
| Sep 21, 2026 | $816.50 |
| Sep 22, 2026 | $808.01 |
| Sep 23, 2026 | $812.02 |
| Sep 24, 2026 | $805.25 |
| Sep 25, 2026 | $821.58 |
| Sep 28, 2026 | $819.95 |
| Sep 29, 2026 | $826.64 |
| Sep 30, 2026 | $810.79 |
| Oct 1, 2026 | $826.35 |
| Oct 2, 2026 | $845.42 |
| Oct 5, 2026 | $848.14 |
| Oct 6, 2026 | $863.44 |
| Oct 7, 2026 | $813.83 |
| Oct 8, 2026 | $796.18 |
| Oct 9, 2026 | $800.47 |
| Oct 12, 2026 | $799.37 |
| Oct 13, 2026 | $772.78 |
| Oct 14, 2026 | $748.98 |
| Oct 15, 2026 | $735.64 |
| Oct 16, 2026 | $730.76 |
| Oct 19, 2026 | $725.79 |
| Oct 20, 2026 | $725.24 |
| Oct 21, 2026 | $740.21 |
| Oct 22, 2026 | $704.05 |
| Oct 23, 2026 | $687.00 |
| Oct 26, 2026 | $692.13 |
| Oct 27, 2026 | $713.31 |
| Oct 28, 2026 | $713.38 |
| Oct 29, 2026 | $647.39 |
| Oct 30, 2026 | $622.75 |
| Nov 2, 2026 | $613.62 |
| Nov 3, 2026 | $623.94 |
| Nov 4, 2026 | $591.30 |
| Nov 5, 2026 | $553.64 |
| Nov 6, 2026 | $558.63 |
Same period: S&P 500 −1.6% · Equal-weight industrials −6.9% · GE Vernova −34.1% · Cummins −36.9%
No slack in the system
On Caterpillar’s Oct 29 earnings call, according to the Motley Fool’s transcript, Evercore ISI analyst David Raso asked whether the modest growth its forecast implied for the fourth quarter pointed to a problem with capacity or suppliers. Chief executive Joe Creed answered with a detail from the factory floor: a test cell in its engine business had gone down for a while. “We had a test cell go down for a little bit in the third quarter that we were able to overcome,” he said on the call, “but there’s no slack in the system.”
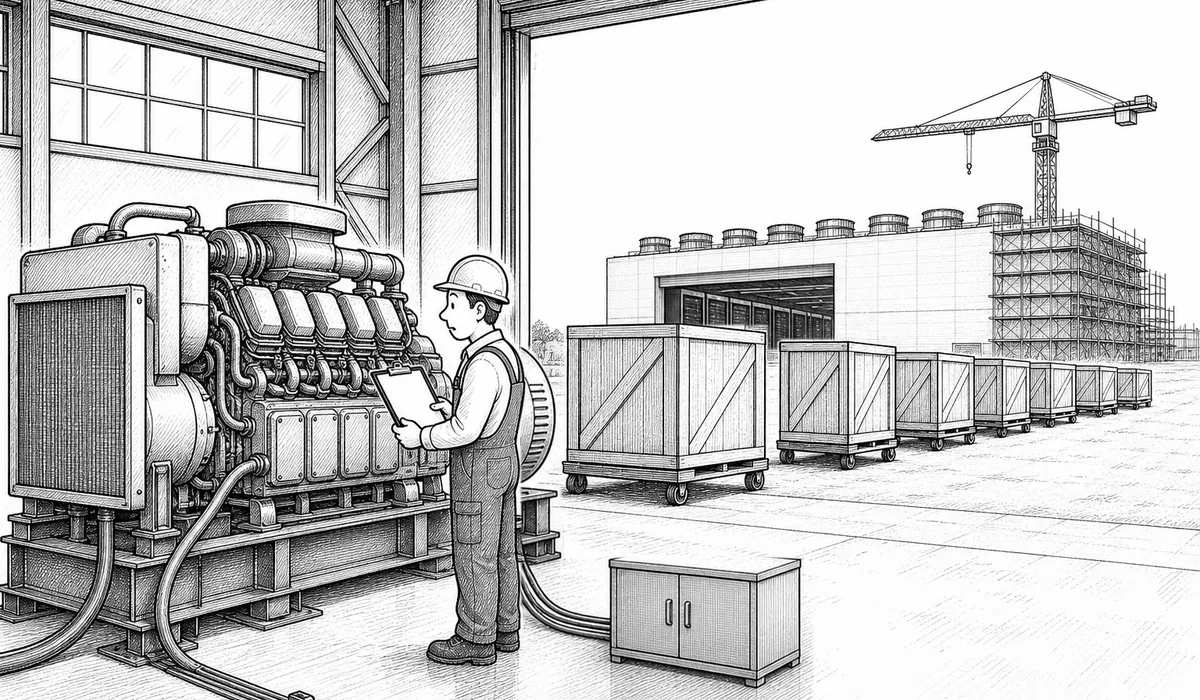
It was a strange problem for a company whose stock was about to fall by nearly a tenth. Demand for Caterpillar’s engines and turbines, much of it from data centers, was running so far ahead of its plants that one broken test stand mattered. The orders waiting to be filled had reached a record. And yet the shares closed 9% lower that day, and by early November they had lost almost half their value since a record close at the end of June.
The year in one line: the shares rose 86% from the start of 2026 to that June record, as orders for power equipment for data centers poured in, and have fallen 47.5% since, leaving them about where the year began. The fall has mostly given back the rise.
Caterpillar is often read as a gauge of the economy, because its machines dig the mines, grade the roads and pour the foundations that growth needs. This year the stock has followed a narrower gauge. It rose with the build-out of artificial-intelligence data centers, and it has fallen alongside other data-center power stocks, while the S&P 500 and industrial stocks as a group fell much less over the same months, on our calculation.
The numbers behind this
The call took place on Oct 29, 2026; Creed was answering David Raso of Evercore ISI (Motley Fool transcript). Caterpillar’s shares fell 9.3% that day and closed at $558.63 on Nov 6, 47.5% below the record close of $1,064.90 on Jun 30 (Yahoo Finance, CNBC; our calculation). At 457.6 million shares, that is about $232 billion of market value. Order backlog: about $78.1 billion at Sep 30, up from $72.1 billion at Jun 30 (10-Q). Power generation sales rose 30% in the quarter to $3.4 billion (release); sales to end users rose 75% (Creed).
The AI rally
The climb began a year earlier. In October 2025, Caterpillar’s shares jumped to a record after it said the artificial-intelligence boom was lifting its sales and profits, the Motley Fool reported; engines sold to data centers had pushed its order backlog to a record. In April, the shares jumped again, to another record, as the company described a backlog “in part fueled by the artificial intelligence infrastructure build-out,” Yahoo Finance reported, and raised its sales forecast.
By the end of June the stock had nearly quadrupled from its spring 2025 low and was the best performer in the Dow Jones Industrial Average this year, as Yahoo Finance later put it. The price had also moved far ahead of the profits. The June record price was about 46 times earnings for the 12 months to June, on our calculation using results reported afterward, against roughly 12 to 19 times at most year-ends over the previous decade.
Data centers are a large customer, but not the largest part of the business. Power generation, the part that sells to them, made up about a seventh of Caterpillar’s sales and revenues in 2025.
The numbers behind this
Closes (Yahoo Finance): $362.76 on Dec 31, 2024; $273.94 on Apr 8, 2025 (the low before the rise); $585.49 on Oct 29, 2025 (+11.6% that day); $572.87 on Dec 31, 2025; $890.11 on Apr 30, 2026 (+9.9% that day); $1,064.90 on Jun 30, 2026. From Dec 31, 2025 to Jun 30, 2026: +85.9%; from Apr 8, 2025: +288.7% (our calculation). The Motley Fool, Oct 29, 2025: shares “climbed more than 11%”; the company “said the artificial intelligence (AI) boom was boosting its sales and profits”; backlog “a record $39.8 billion”. Yahoo Finance (Ines Ferré), Apr 30, 2026: “a record backlog in the first quarter, in part fueled by the artificial intelligence infrastructure build-out”; 2026 revenue growth guidance raised to “low double digits” from about 7%. Yahoo Finance (Jared Blikre), Oct 29, 2026: “Caterpillar, the Dow’s best stock of 2026”.
Price to earnings (our calculation, diluted GAAP earnings per share from the 10-Ks and 10-Qs): using the Jun 30, 2026 close and earnings reported afterward, $1,064.90 ÷ $23.23 (12 months to Jun 30, 2026: $18.81 for 2025 + $5.47 + $7.77 − $4.20 − $4.62) = 45.8 times. At the Nov 6 close, $558.63 ÷ $25.48 (12 months to Sep 30) = 21.9 times. Year-end price ÷ that year’s earnings: 2015 16.3; 2018 12.4; 2019 13.8; 2020 33.3 (pandemic earnings); 2021 17.5; 2022 19.0; 2023 14.7; 2024 16.5; 2025 30.5. 2016 and 2017 are left out: a loss in 2016 and a tax charge in 2017. A Yahoo Finance story by TIKR (Nov 5) put the forward P/E at 42 times on Jun 30. Power generation: $10,275 million of $67,589 million of 2025 sales and revenues, 15.2% (10-K 2025; our calculation).
Still mostly machines
Caterpillar doesn’t say how much it sells to data centers. Those sales sit inside power generation, one of three uses it reports for the engines and turbines of its Power & Energy business, and the company gives no separate dollar figure for them. In the first nine months of the year, power generation was about a sixth of the sales of Caterpillar’s four businesses. Construction Industries and Resource Industries, the traditional machine business (Resource Industries now also includes rail), together accounted for about three-fifths.
Caterpillar's sales by business, first nine months of 2026
Construction Industries and Resource Industries, including rail, made up about 61% of the four businesses' sales; power generation, where data-center power-equipment sales sit, about 16%.
Show the data table
| From | To | Amount | Share of the total |
|---|---|---|---|
| Sales of the four businesses | Construction Industries | $23.3B | 39% |
| Sales of the four businesses | Resource Industries, incl. rail | $12.8B | 22% |
| Sales of the four businesses | Power and Energy | $19.8B | 33% |
| Sales of the four businesses | Financial Products | $3.4B | 5.8% |
| Power and Energy | Power generation | $9.3B | 16% |
| Power and Energy | Oil and gas | $5.7B | 9.6% |
| Power and Energy | Industrial | $4.8B | 8.0% |
Shares are of Sales of the four businesses. Source: Caterpillar 10-Q for Sep 30, 2026: external sales and revenues of the reportable segments, and external sales by application in the Power and Energy segment; shares are our calculation.
Power generation is where the growth had come from. Between 2023 and 2025 it grew by about three-fifths, while construction machines and mining machines each sold less, so power generation added more than Caterpillar’s sales grew in total. This year the machines came back as well, and construction added more dollars of sales than power generation, as dealers stocked their rental fleets. Most of Caterpillar still rides the building and mining cycle; the stock moved with the much smaller part that sells power to data centers.
The numbers behind this
Caterpillar's sales by business and use, change from 2023 to 2025 (%)
Power generation grew about 62%; construction and mining machines each sold about 9% less.
Power generationOther businesses
Show the data table
| Business | Change (%) |
|---|---|
| Power generation | 61.5 |
| Oil and gas | 7.4 |
| Transportation | 3.1 |
| Resource Industries | -8.6 |
| Construction Industries | -9.1 |
| Industrial | -16.4 |
Shares, first nine months of 2026 (our calculation): of $59.296 billion of external sales and revenues of the four reportable segments, Construction Industries $23.275 billion (39.3%), Resource Industries $12.807 billion (21.6%), Power & Energy $19.796 billion (33.4%) and Financial Products $3.418 billion (5.8%). Power & Energy by application: power generation $9.336 billion (15.7% of the four), oil and gas $5.703 billion, industrial $4.757 billion. Construction Industries and Resource Industries, including rail, together: 60.9% (rail sales in the first nine months: $2.471 billion, 10-Q).
Basis: from Jan 1, 2026, rail moved from Power & Energy to Resource Industries, with 2025 restated (10-Q segment note), so nine-month figures aren’t comparable with the 2023–2025 chart for those two segments. Power generation and Construction Industries are unaffected.
2023 to 2025 (10-K 2025): reportable segments’ external sales $67.763 billion to $68.348 billion (+$0.585 billion); power generation $6.362 billion to $10.275 billion (+$3.913 billion). First nine months of 2026 against 2025 (10-Q): the four segments +$10.298 billion; Construction Industries +$5.321 billion (+29.6%); power generation +$2.299 billion (+32.7%); Resource Industries +13.4%; oil and gas +11.7%; industrial +6.0%. The company gives no dollar figure for data-center sales; we found no named analyst estimate either.
When the AI trade turned
The first blow came the day after the record. Michael Burry, the investor who bet against subprime mortgages before 2008, disclosed a short position, a bet that the shares would fall, on July 1. Fortune reported that he had taken it the previous day as part of his view that the market was in an AI bubble; Caterpillar fell nearly 7% on July 1. A Freedom Broker analyst told Fortune that the rise was “a structural theme,” not hype, but that a weakening in the big cloud companies’ cash flow or debt could pull the stock’s valuation down.
In late October and early November, Yahoo Finance described selling in AI-related stocks extending to companies supplying data centers. When Caterpillar fell 9% on its results in late October, Yahoo Finance wrote that “Wall Street is still dumping stocks tied to the AI build-out, and an earnings beat offers no protection.” After the election, a Yahoo Finance story by TIKR described “the AI selloff” spreading “to the industrials that build and power data centers,” with Caterpillar among them; a UBS strategist noted that governors favoring pauses on data-center building had won in several states.
The Motley Fool and Yahoo Finance linked the rise to AI demand; Fortune linked the first sharp drop to Burry’s AI-bubble short, and Yahoo Finance linked the Oct 29 and Nov 5 declines to selling in AI-related stocks. The next sections compare the economic backdrop and examine Caterpillar’s own outlook, which Trefis linked to the Oct 29 decline.
The numbers behind this
Fortune (Marco Quiroz-Gutierrez), Jul 2, 2026: Burry “shorted Caterpillar at $1,060.98 per share Tuesday” (Jun 30); “By Wednesday, Caterpillar shares had closed down nearly 7%”; the short “builds on his broader belief that the market is in an AI bubble”. Sergey Glinyanov, senior analyst at Freedom Broker: “A structural theme is emerging”; “Should we observe deterioration in hyperscalers’ fundamentals—particularly cash flow generation or debt burden”, “multiples could face a meaningful pullback”. Caterpillar: −6.9% on Jul 1 (S&P 500 −0.2%). Yahoo Finance (Jared Blikre), Oct 29, 2026. Yahoo Finance (Michael Douglass, TIKR), Nov 5, 2026: “the AI selloff that hit chip and storage stocks”; “spread to the industrials that build and power data centers”; Keith Parker, UBS strategist: “governors favoring data center pauses won in a number of states, including Texas.” Caterpillar: −5.2% on Nov 4 and −6.4% on Nov 5.
A gauge that stopped tracking the economy
The American economy that Caterpillar sells into is mixed rather than weak. Factories expanded in October for a tenth straight month, the Institute for Supply Management reported, and machinery was among the industries that grew. One machinery maker told the institute that business was strong, “largely driven not only by data centers and mission critical infrastructure, but also the continued replacement of municipal infrastructures.”
Building is weaker. The Census Bureau found construction spending in the first nine months of the year a little below the same months of 2025, with home building sliding in September. Caterpillar’s construction sales in North America nonetheless grew by more than a third. Creed credited dealers loading machines into their rental fleets, roads and bridges still being paid for by the federal infrastructure law, and data centers, which he said “have a little bit of a rollover” into its construction business too.
Money has also become dearer. The Federal Reserve raised its benchmark rate in September and held it in October, with two of its voters asking for another increase. Caterpillar’s customers are still paying: overdue payments at its finance arm were the lowest it has recorded since 1998, finance chief Kyle Epley said.
Set against all of that, Caterpillar’s fall stands out. The broad market barely moved from the end of June to early November, and industrial stocks as a group fell modestly. What fell almost as hard as Caterpillar were the other companies that sell power equipment to data centers.
Change from Jun 30 to Nov 6, 2026 (%)
The S&P 500 and industrial stocks barely moved; data-center power suppliers fell 20–45%, and Caterpillar fell 47.5%.
Show the data table
| Stock or index | Change (%) |
|---|---|
| Caterpillar | -47.5 |
| Vertiv | -45.4 |
| Cummins | -36.9 |
| GE Vernova | -34.1 |
| Eaton | -19.8 |
| Equal-weight industrials | -6.9 |
| S&P 500 | -1.6 |
| Deere | 5.9 |
Caterpillar's 47.5% fall, split by benchmark (percentage points)
About 13 of the 47.5 points go beyond the average fall of the data-center power group, which itself fell far more than the market and industrials.
Show the data table
| Part | Points |
|---|---|
| The market (S&P 500) | -1.6 |
| Industrials beyond the market | -5.3 |
| Data-center power stocks beyond industrials | -27.2 |
| Caterpillar beyond the group | -13.4 |
The numbers behind this
ISM: Manufacturing PMI 55.5 in October, up from 54.5; “expanded in October for the 10th consecutive month” (ISM release, Nov 2, 2026, via PRNewswire). Census: construction spending for January–September 2026 was $1,649.6 billion, 2.9% below the same period of 2025; September was 1.9% below August, with private residential down 5.5% on the month (release CB26-176, Nov 2, 2026). Caterpillar: Construction Industries sales in North America rose 39% in the first nine months of 2026 (10-Q). Fed: raised the target range by 0.25 point to 3.75–4% on Sep 16 (12–0) and held it on Oct 28 (10–2; Lisa Cook and Beth Hammack preferred a rise). Cat Financial past dues: “the lowest level we have recorded since 1998” (CFO Kyle Epley).
Split (our calculation), percentage-point changes from Jun 30 to Nov 6: S&P 500 −1.6; equal-weight industrials −6.9, so −5.3 beyond the market; the average of Cummins (−36.9), GE Vernova (−34.1), Vertiv (−45.4) and Eaton (−19.8) is −34.1, so −27.2 beyond industrials; Caterpillar −47.5, so −13.4 beyond that group. The split compares changes between the same two dates, not their causes, and depends on the group we chose. We used the equal-weight fund rather than XLI (−12.2%) because XLI is weighted by size and holds Caterpillar and GE Vernova heavily. Deere, a machinery maker with no data-center business, rose 5.9%.
Abroad, a smaller share
Caterpillar is a global company, but this year’s growth has been mostly in North America. Its sales outside North America still rose, by roughly a tenth in the first nine months, but sales in North America grew about three times as fast, so the share sold abroad slipped to about two-fifths.
Caterpillar sales growth by region, first nine months of 2026 vs 2025 (%)
North America grew about 31%; Europe, Africa and the Middle East 16%, Latin America 10% and Asia/Pacific 2%.
Show the data table
| Region | Growth (%) |
|---|---|
| North America | 30.7 |
| Europe, Africa, Middle East | 16.2 |
| Latin America | 10.3 |
| Asia/Pacific | 1.9 |
The picture abroad is mixed rather than weak. Europe is “expected to remain stable,” Creed said, and Africa strong, while the Middle East “continues to face challenges.” Latin America grew more slowly than the company had expected. In China, where property investment fell by a fifth in the first nine months, according to the National Bureau of Statistics, Caterpillar’s sales “continued to grow from a low base.”
Mining, Caterpillar’s third big business, has been slower. Sales of its mining and quarry machines to users rose only a little in the third quarter, below what the company expected, and sales for mining itself were lower because of shipping and commissioning delays. “Most key commodities remain above investment thresholds,” Creed said, pointing to copper and gold, and he said orders had been strong for three quarters. Taken together, that is slower growth abroad and in mining, not a slump, set against a share price that has almost halved.
The numbers behind this
Share of sales and revenues outside North America (our calculation from the 10-K for 2025 and the Q3 2026 10-Q): 48.4% in 2023, 46.9% in 2024, 45.8% in 2025 and 41.4% in the first nine months of 2026 (45.8% a year earlier). Sales outside North America rose 9.5% in the first nine months; total sales and revenues rose 21%. By segment, first nine months of 2026, external sales of the reportable segments: Construction Industries 39%, Power & Energy 33% (the segment formerly called Energy & Transportation), Resource Industries 22%, Financial Products 6%. China: real-estate development investment fell 20.6% in January–September 2026 (NBS, Oct 20, 2026). Resource Industries sales to users rose 4% in Q3, “below our expectations” (Creed).
Priced for a raise
Trefis, a research firm, linked the stock’s steepest day, Oct 29, to disappointment over the sales outlook. In August, Caterpillar had raised its forecast for 2026 sales growth to the mid-to-high teens. In October it kept that forecast rather than raising it again, and it guided only to “moderate” growth in the fourth quarter, as dealers cut the machines they hold in stock by more than they did a year earlier. The stock “had been priced for a raise,” Trefis wrote.
Other numbers pointed the same way. Caterpillar said its full-year adjusted operating margin, excluding tariff refunds, would sit near the bottom of its target range; Creed told Truist analyst Jamie Cook the company was “skipping along the bottom” and hoped to get back to the middle over the next couple of years. Tariffs will cost it about $2.2 billion this year. And Baird analyst Mig Dobre noted that orders relative to sales had slipped. Creed’s reply was that “you can’t just look at 1 metric like backlog growth in a quarter or book-to-bill in a quarter.”
Investing.com reported on Nov 4 that DA Davidson put the stock’s premium to its peers at roughly 50%, despite the decline. Morgan Stanley cut its price target to $675 the day after the results. Most analysts still rate the shares a buy, though: MarketBeat counted 15 buy ratings and 12 holds in early November, and Citi kept its buy while cutting its target to $800.
The numbers behind this
Outlook: “low double digits” growth for 2026 (10-Q, Q1), raised to “mid-to-high teens” (10-Q, Q2, Aug 5), kept (10-Q, Q3, Nov 4). Q4: “moderate” sales growth; a seasonal dealer inventory decrease of about $1.6 billion, against $600 million in Q4 2025. Q3: sales and revenues $20.7 billion (+17%) against $20.37 billion, the S&P consensus per StockStory; adjusted profit per share $7.20 against $7.03; adjusted operating margin 20.6% (17.5% a year earlier). Tariffs: about $2.2 billion for 2026, excluding about $520 million of refunds of tariffs struck down by the Supreme Court. Backlog growth: $9.4 billion in Q2, $6.0 billion in Q3. Book-to-bill: from “as high as 1.7” to “about 1.3” (Dobre). Analysts: Morgan Stanley (Equal Weight) $915 to $675, Oct 30 (MarketBeat); Citi (Buy) $950 to $800, Nov 2 (Stock Analysis); MarketBeat consensus, Nov 2: 15 Buy, 12 Hold, average target $913.96.
Debt at Sep 30, 2026 (10-Q balance sheet): $45.2 billion consolidated, which includes $34.6 billion at Cat Financial, mostly funding its loans to customers and dealers; Machinery, Power & Energy debt alone is $10.65 billion. Cash and investments, consolidated: $11.9 billion, made up of $7.9 billion of cash and cash equivalents and $4.0 billion of available-for-sale debt securities (10-Q Note 8). Of those, Machinery, Power & Energy held $1.6 billion of securities and time deposits, and Cat Financial and the insurance arm about $2.4 billion.
The week of the election
The last leg of the fall came this week. On the day after Democrats won Congress, Caterpillar fell 5.2% while the S&P 500 rose. That morning Reuters reported that data-center stocks were slipping on prospects of “tougher oversight of the AI boom,” though it added that “analysts doubt any legislation could meaningfully stall data center construction.” The report didn’t mention Caterpillar. The next day the whole market fell hard, led by technology stocks, and Caterpillar fell with it.
The numbers behind this
Caterpillar: −5.2% on Nov 4 (S&P 500 +1.6%), −6.4% on Nov 5 (S&P 500 −4.4%), −10.3% for the week from the Oct 30 close of $622.75 (Yahoo Finance, our calculation). Reuters via Investing.com, Nov 4 and Nov 5.
What the test cell says
The demand Creed described has not gone away. Caterpillar is taking some engine orders as far out as 2029 and turbine orders into 2030, he said, and the company expects dealers to end the year with more machines than they started it with, ahead of what it expects to be strong sales in 2027. What has changed is the share price, which has fallen sharply alongside those of other data-center power suppliers.
The numbers behind this
Creed on orders: “we’re now taking some large reciprocating orders as far out as 2029 and turbine orders into 2030.” On 2027: “we’ll talk to you more about ’27 in January.” CFO Kyle Epley: dealer inventories expected to end 2026 higher than at the end of 2025 “in anticipation of strong sales to users in 2027.” About 58% of the backlog is expected to be sold within 12 months (59% in Q2). Earlier falls from a record close (Yahoo Finance daily closes since 2005, our calculation): 2007–09 −74.5%; 2012–16 −50.2%; 2018–20 −46.3%. Year to date: −2.5% from the 2025 close of $572.87, after an 86% rise to the June record.
Price to earnings (our calculation, diluted GAAP earnings per share for the past 12 months, from the 10-Ks and 10-Qs): about 45.8 times at the Jun 30 record, using the 12 months to June, reported afterward; about 21.9 times at the Nov 6 close, using the 12 months to September. Year-end price over that year’s earnings, 2015–2025, was 12.4–19.0 times in seven of the nine years shown (2020: 33.3, pandemic earnings; 2025: 30.5); 2016 and 2017 are left out (a loss and a tax charge). This is arithmetic on past figures, not a forecast.
In January, Creed said, Caterpillar will say more about 2027. Until then, the story sits on the factory floor where it began. “It is hand to mouth,” he said of the power business. At the June record the shares cost about 46 times the past year’s earnings; at the latest close they cost about 22 times, on our calculation, still above the 12 to 19 times at most year-ends of the past decade. That leaves an open question. Do Caterpillar’s profits grow into today’s price, so that the shares can hold their ground, or does the multiple keep sliding back toward its history, which at today’s profits would mean a lower share price?
The other view
Most analysts still rate the stock a buy: MarketBeat counted 15 Buy and 12 Hold ratings on Nov 2, with an average target of $913.96, and Citi kept its Buy while cutting its target to $800 from $950.
What to watch next
- Late Jan 2027 (expected)
- Fourth-quarter results, against the "moderate" sales growth Caterpillar expects, and its first outlook for 2027.
- Each quarter
- Backlog and orders, especially in Power & Energy, the segment that sells engines and turbines for data centers.
- 2027 budgets
- Data-center spending plans of big cloud companies, and any local or federal limits on new data-center building after the midterms.
Quick questions
Is Caterpillar down this year?
Only slightly. It closed at $558.63 on Nov 6, about 2.5% below its 2025 closing price of $572.87, after rising about 86% to its Jun 30 record of $1,064.90 (Yahoo Finance closing prices, our calculation).
What is Caterpillar's order backlog?
The dollar value of orders Caterpillar believes to be firm but hasn't yet filled. It was about $78.1 billion at Sep 30, 2026, of which about $32.6 billion wasn't expected to be filled within 12 months, the 10-Q says.
What does Caterpillar sell to data centers?
Large reciprocating engines and gas turbines, sold through its Power & Energy segment, used to power data centers and to provide backup. Power generation sales rose 30% in the third quarter, to $3.4 billion, and sales to end users grew 75%, the CEO said.
About Caterpillar: Website (external site)Investor relations (external site)SEC filings (external site)Wikipedia (external site)
+ 22 more
Accessed Nov 7, 2026: Caterpillar: Q1 2026 report (SEC 10-Q) · Caterpillar: Q2 2026 report (SEC 10-Q) · StockStory: Q3 results against S&P consensus · Trefis: why Caterpillar fell on Oct 29 · Investing.com: why Caterpillar stock is sliding, Nov 4 · MarketBeat: Morgan Stanley cuts its target, Oct 30 · The Cerbat Gem (MarketBeat data): analyst ratings, Nov 2 · Reuters, via Investing.com: AI data-center stocks dip after the midterms · Reuters, via Investing.com: oil and data-center stocks sink after the midterms, Nov 5 · Institute for Supply Management: October 2026 Manufacturing PMI (PRNewswire copy) · US Census Bureau: construction spending, September 2026 · Federal Reserve: FOMC statement, Sep 16, 2026 · Federal Reserve: FOMC statement, Oct 28, 2026 · National Bureau of Statistics of China: real-estate investment, Jan–Sep 2026 · Stock Analysis: Caterpillar analyst actions · Caterpillar: 2025 annual report (SEC 10-K) · Fortune: Michael Burry shorts Caterpillar, Jul 2, 2026 · Yahoo Finance: Caterpillar, the Dow's best stock of 2026, is unraveling, Oct 29, 2026 · Yahoo Finance (TIKR): AI selloff spreads to industrials, Nov 5, 2026 · Yahoo Finance: Caterpillar stock jumps after first-quarter earnings, Apr 30, 2026 · Kiplinger: Caterpillar sinks after Burry unveils new short position, Jul 1, 2026 · The Motley Fool: why Caterpillar jumped to a record, Oct 29, 2025
Quoting this? You may quote short excerpts under our reuse policy. Please credit WhyMyStockMoved.com and link to this page.