The driver goes, the car stays: what robotaxis would reprice, from insurance to gas pumps
If robotaxis become common in US cities, which industries and stocks change, and who pays?
Robotaxis are past the demo stage in one company's hands: Waymo passed half a million paid rides a week this spring and serves 15 US metro areas, while Tesla, Amazon's Zoox and the ride-hailing apps are still small. If they become common, the money tied to a human driver moves first: drivers' pay, personal car insurance, crash costs, fuel and parking. Insurers warn about self-driving cars in their filings; Uber and Lyft say robotaxis grow their market. The safety record is short: the IIHS found 68% fewer police-reportable crash involvements per mile for Waymo's driverless cars than for human drivers, from 64 crashes over about 50 million miles in four cities in 2021–24. How fast robotaxis spread depends on cost, that record and rules that cities and states are still fighting over.
The car came to the recreation center, because Leigh Paterson’s house was outside its map. KUNC’s editor walked about 20 minutes from home in Denver to meet it in September, she wrote, and watched people on the street stare as the baby-blue van pulled up and opened its trunk on its own. The ride downtown was “uneventful”, she wrote; it braked normally and changed lanes smoothly. Afterwards she booked a car with a human driver, because it could take her “right to my door, instead of a mile away.”
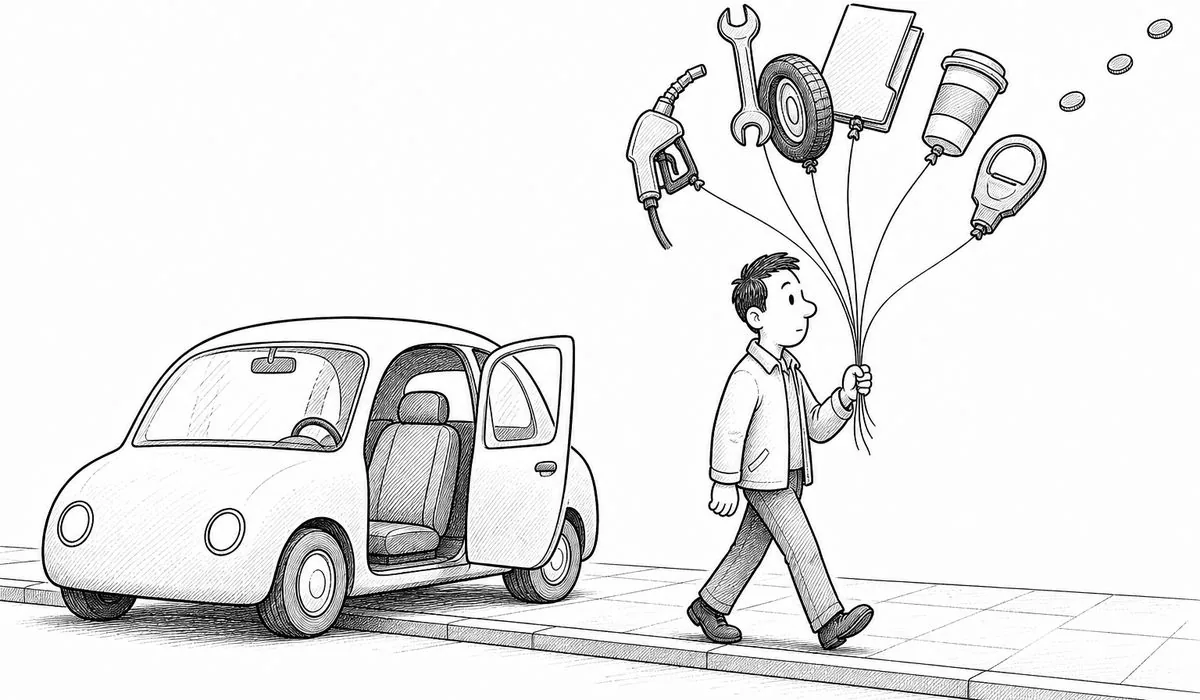
That walk is where robotaxis are now: real, paid, and still bounded by a line on a map. Waymo, Alphabet’s self-driving unit, had passed half a million paid rides a week by the spring, Alphabet said, and it now serves 15 metro areas. If cars like Paterson’s become common, the change is not the one cars brought to the horse. This time the vehicle stays and the driver goes, so the money that moves is the money tied to a person behind the wheel: what drivers earn, what owners pay to insure and repair their cars, what crashes cost, and what gets spent on fuel and parking.
One company at scale
Waymo grew tenfold in under two years, from about 50,000 paid rides a week in May 2024 to 500,000 by March 2026, TechCrunch reported. It is still a small business inside Alphabet. Other Bets, the segment that holds Waymo and other ventures, lost about $2 billion in the third quarter, Fortune reported from Alphabet’s results.
Everyone else is earlier. Tesla says its driverless service has run about 2 million unsupervised miles, in parts of a few cities, and its chief executive, Elon Musk, said robotaxis will start to contribute to Tesla’s financials in 2027, CNBC reported. Amazon’s Zoox shifted its roughly 65-vehicle Las Vegas fleet to paid rides in August, Casino.org reported. Uber expects about 700 driverless cars on its app by the end of this year.
Price is the other test. In the Bay Area, Waymo’s quoted rides averaged about 13% more than Uber’s over the winter, down from about 31% in the spring of 2025, according to a study by the research firm Obi that TechCrunch reported; one survey’s narrowing gap doesn’t establish a trend.
Average quoted ride price in the San Francisco Bay Area, by service ($ per ride offer)
Waymo's quotes cost more than Uber's and Lyft's in both surveys; its premium over Uber narrowed from about 31% to about 13% between them.
Mar to Apr 2025Nov 2025 to Jan 2026
Two survey windows only, not a long-run series: quotes from Obi's simulated ride requests, not fares paid, nearly 90,000 from Mar 25 to Apr 25, 2025 and 94,348 from Nov 27, 2025 to Jan 1, 2026 (the later sample also had Tesla, not shown). Lowest shown: Lyft, $14.44; highest: Waymo, $20.43, both in spring 2025.
Show the data table
| Service and period | Average fare ($) |
|---|---|
| Waymo, spring 2025 | 20.43 |
| Uber, spring 2025 | 15.58 |
| Lyft, spring 2025 | 14.44 |
| Waymo, winter 2025-26 | 19.69 |
| Uber, winter 2025-26 | 17.47 |
| Lyft, winter 2025-26 | 15.47 |
The numbers behind this
Waymo: 50,000 paid rides a week in May 2024 and 500,000 in March 2026 (TechCrunch, Mar 27, 2026); “surpass 500,000 fully autonomous rides a week” (Alphabet, Q1 2026 release); 15 million rides in 2025 (Waymo, via Fortune). Metros: 13 in Waymo’s own app plus Austin and Atlanta through Uber (Waymo FAQ, Nov 2026); Waymo’s reported goal is 1 million a week by the end of 2026, with no newer official count found. Fleet: a December 2025 recall filing covered 3,067 Waymo vehicles. Alphabet’s Other Bets: Q3 2026 revenue $372 million and an operating loss of about $2.0 billion (Fortune, from Alphabet’s results); the segment includes businesses other than Waymo. Tesla: about 2 million cumulative unsupervised miles by the end of Q3 2026 (Tesla Q3 update); its Bay Area service still has safety drivers (Electrek). Zoox: first federal commercial exemption for a purpose-built robotaxi, Jul 30, 2026 (TechCrunch); about 65 vehicles in paid service in Las Vegas (Casino.org, Aug 11, 2026). Uber: about 700 driverless vehicles on its app by the end of 2026 and more than 2,000 by the end of 2027 (Q3 2026 remarks). Quoted prices (Obi, via TechCrunch): $19.69 ÷ $17.47 − 1 = 12.7%, about 13%; spring 2025, $20.43 ÷ $15.58 − 1 = 31.1%, about 31% (our calculation). For scale, AAA’s 2026 model gives a weighted average cost of owning and running a new car of $12,863 a year, across 34 models in seven categories, over five years and 75,000 miles; category averages run from $9,259 for small sedans to $16,449 for half-ton pickups. That is an ownership benchmark, not the saving from replacing individual trips.
The driver goes, the car stays
Earlier changes in how Americans travel repriced land. When cars and tractors replaced horses, farmland that had grown their feed was freed: about 93 million acres of cropland fed horses and mules in 1915, and about 5 million by 1960, the economic historians Alan Olmstead and Paul Rhode found. Railroads before them had made distance cheap, and farmland near the lines was worth far more; using farmland values from 1870 to 1890 in 2,327 counties, the economists Dave Donaldson and Richard Hornbeck estimated that removing the railroads in 1890 would have cut the value of US farmland by about 60%.
A robotaxi is a different kind of shift. It keeps the vehicle and the road, and removes the person. That points the change at the costs a driver brings: wages, the insurance that covers human error, the crashes those errors cause, and the parking a private car needs while its owner works. These are two analogies, not a guide to how fast robotaxis will spread. Horses lost to a new machine; here the machine is the same car, and the rules are being written city by city rather than through land grants and charters.
| Acres of US cropland used to feed horses and mules | Million acres |
|---|---|
| 1915 (peak) | about 93 |
| 1930 | about 65 |
| 1960 | about 5 |
Source: Olmstead and Rhode, Journal of Economic History, 2001, citing USDA data. Three selected national estimates, not an annual series.
Where the money sits
The pools tied to a human driver are large. Americans paid about $371 billion in personal car insurance premiums in 2025, insurance regulators’ data show. Convenience stores, which sell most of the country’s fuel, took about $476 billion for it. Crashes cost the economy about $340 billion in 2019, in medical bills, damaged property and lost work, NHTSA estimated; about three-quarters of that is paid by people who weren’t in the crash.
None of these would vanish quickly. The sources we reviewed don’t show how robotaxis have changed car ownership, fuel sales or parking revenue in the cities they serve. The pools show what’s at stake, not what has moved.
Selected yearly US spending and costs tied to driving ($ billions; years and coverage differ)
Car sales, fuel, personal car insurance and crash costs each run to hundreds of billions of dollars a year.
Not additive: dealer sales include parts and service and vehicles other than personal cars; crash costs cover all motor-vehicle crashes and overlap with insurance. Uber's figure is worldwide, shown for scale only. Auto loans outstanding ($1.73 trillion) are a balance, not a yearly flow, so they are left out.
Show the data table
| Money pool | $ billions a year |
|---|---|
| Franchised dealers’ sales, new and used cars and service (2025; more than) | 1300 |
| Fuel sold at convenience stores (2025) | 476 |
| Personal car insurance premiums (2025) | 371 |
| Economic cost of crashes (2019) | 340 |
| Uber rides, gross bookings, worldwide (Q3 2026 × 4) | 118 |
The losers say it themselves
Insurers are the clearest case, because they put it in writing. Allstate’s annual report says self-driving cars or more ride- and car-sharing could “reduce the size of the automobile insurance market.” Progressive, which writes most of its premiums on personal cars, lists autonomous vehicles as a risk too, and it insures Uber’s drivers in 14 states, a block that was 14% of its commercial premiums last year. If driverless rides replace those trips, both parts of its book are exposed, though neither company has put a number on it.
The evidence on crashes points the same way. An independent study by the Insurance Institute for Highway Safety, published in July, found that per mile, Waymo’s driverless cars were involved in 68% fewer police-reportable crashes than human drivers in the same places and years. The record is short: about 50 million driverless miles and 64 such crashes, in four cities from 2021 to 2024, compared with about 222 billion miles driven by people. Waymo reports its own comparisons, on different measures. Fewer crashes per mile would help whoever pays for crashes, including insurers’ customers, hospitals and employers, and hurt the businesses that live on them.
Copart, which auctions damaged cars, gets 79% of the vehicles it processes from insurers, its annual report says. Fewer write-offs would mean fewer cars through its yards; that is our inference, not the company’s. The picture for parts sellers is murkier: O’Reilly ties demand to miles driven and the number of cars on the road, and the effect depends on whether lower crash rates and fewer private cars outweigh heavier use of each fleet car.
Fuel is the other written-down risk. Retail fuel is about 60% of Casey’s revenue. Waymo’s, Tesla’s and Zoox’s fleets are all electric, so each robotaxi trip that replaces a petrol-car trip means less fuel sold; how much depends on the car it replaces, and the sources we reviewed don’t measure the effect on fuel sales.
The numbers behind this
Allstate: auto premiums written $38.6 billion in 2025, about 65% of Allstate Protection premiums (10-K; our calculation). Progressive: personal vehicles 96% of Personal Lines premiums, of which personal auto 95% (10-K); its Uber transportation-network-company business was 14% of Commercial Lines premiums in 2025. IIHS (Teoh, Kidd and Riexinger, July 2026): 68% lower police-reportable crash involvement per mile for Waymo’s level-4 cars in driverless operation, 2021–24, in four cities; by city, from 76% lower in Phoenix to 4% higher in Austin, where the sample was small; “these results apply only to the L4 vehicles in driverless operation that were studied.” Waymo’s safety hub: 271.3 million cumulative rider-only miles through June 2026, with a 95% lower rate per mile of crashes involving serious injury or death than its human benchmark (company figures; different measure, period and markets from the IIHS study). Copart: 79% of vehicles processed in fiscal 2026 came from insurance-company sellers (10-K). Casey’s: retail fuel 60.4% of revenue (about 60%), fiscal year to Apr 30, 2026 (10-K). NHTSA crash costs: $340 billion in 2019, including $31 billion medical, $115 billion property damage and $106 billion lost productivity; about $1.4 trillion including quality of life.
Partners or bypassed?
Uber and Lyft could end up either way, and they argue the first. Uber said this month that ride-hailing in its mature US robotaxi markets had grown faster than in the rest of the country for several quarters, and that its own position there had grown; it didn’t name the cities or the exact quarters. Lyft said its San Francisco area had its strongest growth among the areas it shares with driverless cars. Both are recasting themselves as fleet managers too: Lyft services Waymo’s cars in Nashville, and Uber says it is developing ways to finance operators’ fleets.
The risk is in Waymo’s map. It runs its own app in 13 of its 15 metros. Tesla and Zoox also sell rides directly. Uber argues that cars on its network get more trips a day than on an operator’s own app, without disclosing the sample behind that comparison; operators would trade a fee for access to its riders.
Rental companies are split the same way. Avis is Waymo’s fleet partner in Dallas; its chief executive, Brian Choi, described the partnership as part of a move into fleet management and operations. Hertz lists rivals offering self-driving cars among its risks. Lenders face a similar fork: Ally says its dealer business “depends on the continuation of the key role of dealers,” while Waymo took its first loan, of $5 billion, in October.
Who writes the rules
This month, a committee of the District of Columbia Council split 3–3 on a bill that would have let robotaxis operate in the city, so it doesn’t move forward, NBC Washington reported. The sponsor, Councilmember Charles Allen, had rewritten it to add workers’ rights and limits on traffic; other members, including the incoming mayor, Janeese Lewis George, said it wasn’t the right time. In its summer form, the bill would have charged operators $6 million for a three-year permit and 15 cents a mile, partly to retrain ride-hail drivers, Reason reported.
Drivers face the loss of the work itself. The Bureau of Labor Statistics counted about 456,000 jobs for taxi drivers, shuttle drivers and chauffeurs, including ride-hail drivers for whom it is the main job, in 2025, and drivers and their unions have been in the room. “As it stands now, the bill would funnel money to Waymo executives in Silicon Valley,” Jaime Contreras, executive vice president of the union 32BJ SEIU, told Reason in July. Waymo answered the vote by saying that more people had died on DC’s roads this year than when the city launched its traffic-safety program, NBC Washington reported.
Federal rules set the outer limits. A maker seeking a federal exemption for cars that don’t meet the safety standards written for human drivers is generally limited to 2,500 a year, and Zoox won the first commercial one in July. Tesla self-certified its Cybercab, which has no steering wheel or pedals, and regulators opened an audit of about 1,000 of them in September. They are also reviewing whether a Waymo software fix for passing stopped school buses fully worked. Texas and California have set their own regimes this year; Minneapolis, Boston and New York remain open fights.
| Group | What it gains or loses | Can it write a rule? |
|---|---|---|
| Operators (Waymo, Tesla, Zoox) | Ride revenue; heavy investment in vehicles and fleets | Through federal exemptions and state permits |
| Ride-hail apps | The aggregator, or the bypassed party | By lobbying on access, airports and fees |
| Drivers and unions | Driving jobs at risk of replacement | Opposition in DC and several states |
| Insurers | A smaller personal-auto pool; more fleet cover | Through state insurance rules |
| Cities and airports | Parking money; permit fees | Yes: permits, curbs and per-mile charges |
Where the stocks stand
For investors, the exposure shows up most plainly where a single line of business supplies most of the revenue. The table below shows what each company’s own filings say; it isn’t a ranking of who will win or lose, and none of the companies has put a number on the effect.
| Company (ticker) | What its filings show | Direction, on the evidence |
|---|---|---|
| Lyft (LYFT) | “Substantially all” revenue from ride-sharing | Both ways: partner and possibly bypassed |
| Uber (UBER) | Mobility about half of revenue; US and Canada about half | Both ways; expects about 700 driverless cars on its app by year-end |
| Tesla (TSLA) | Automotive revenue, including leasing and regulatory credits, about 73% of 2025 revenue | Both ways: robotaxis are its stated upside |
| Alphabet (GOOGL) | Other Bets, including Waymo, about 0.3% of sales, with an operating loss of about $2 billion in Q3 2026 | Gains if Waymo scales |
| Progressive (PGR) | Personal auto about 91% of Personal Lines premiums; Uber’s drivers 14% of Commercial Lines | At risk; autonomous vehicles named as a risk |
| Allstate (ALL) | Auto about 65% of Protection premiums | At risk; says AVs could shrink the market |
| Copart (CPRT) | 79% of vehicles from insurers | At risk if crashes fall (our inference) |
| Casey’s (CASY) | Fuel about 60% of revenue | At risk as electric fleets replace petrol trips |
| Ally (ALLY) | $108.7 billion of auto finance receivables and loans | Both ways: fewer consumer loans, more fleet finance |
| Avis (CAR), Hertz (HTZ) | Avis is Waymo’s Dallas fleet partner; Hertz names AVs as a risk | Both ways |
| Mobileye (MBLY), NXP (NXPI), onsemi (ON) | Mobileye nearly all automotive; cars about 58% of NXP’s and 51% of onsemi’s revenue | Gains if more chips go into each car |
| Nvidia (NVDA)* | No longer reports car revenue on its own | Exposed through car computing; robotaxi revenue not disclosed |
*Editors hold Nvidia.
The forecasts differ even on the same measure. Morgan Stanley’s analysts see about 2.5 million robotaxis worldwide by 2035; Goldman Sachs Research has put it at about 6 million. Their dollar estimates cover different markets and years, so they can’t be set side by side. Uber itself says its “much larger commercial ramp” begins in 2028.
The numbers behind this
Lyft: “Substantially all of our revenue is generated from our ridesharing marketplace” (2025 10-K). Uber: Mobility $7.52 billion of $14.77 billion of Q3 2026 revenue; US and Canada $26.5 billion of $52.0 billion in 2025 (8-K, 10-K; our calculation). Tesla: automotive $69.5 billion of $94.8 billion in 2025 (10-K; our calculation). Alphabet: Other Bets Q3 2026 revenue $372 million, 0.29% of Alphabet’s sales (about 0.3%), operating loss about $2.0 billion (Fortune, from Alphabet’s results). Progressive: 96% × 95% ≈ 91% (our calculation). Ally: Automotive Finance finance receivables and loans $108.7 billion at the end of 2025 (10-K). Mobileye: Q3 2026 revenue $492 million; 2026 guidance $1.995–2.020 billion (8-K). NXP: automotive $7.1 billion of $12.3 billion in 2025 (10-K; our calculation). onsemi: automotive about 51% of 2025 revenue (10-K). Nvidia: reports “Edge Computing” ($7.2 billion in the quarter to Jul 26, 2026) instead of automotive (10-Q). ChargePoint lists the risk that it “may not attract a sufficient number of EV fleet owners or operators” (10-K). Morgan Stanley (Jul 17, 2026): about 2.5 million robotaxis worldwide by 2035, about 70% in the US and China; about $1 trillion “across mobility services, vehicles, software and adjacent industries” by 2040. Goldman Sachs Research (April 2026): a global commercial fleet of about 6 million in 2035, and a US robotaxi market of about $19 billion in 2030 and $48 billion in 2035. Uber’s Q3 2026 Mobility gross bookings were $29.5 billion, about $118 billion a year, worldwide (our calculation; a size check, not a share).
The line on the map
The line that sent Paterson on a 20-minute walk is the one to watch. Each time Waymo or a rival pushes it outward, into a new suburb, an airport curb or a snowier city, more of the trips that now involve a human driver, a parked car and a tank of petrol are up for grabs. Where it stops, as it has for now in Washington, the people who would pay first have won some time.
The companies that live on those trips have already written down what they fear. The question for the next few years is whether the line moves fast enough for it to show up in their results.
What to watch next
- End of 2026
- Waymo's target of 1 million paid rides a week, as reported; Uber expects about 700 driverless cars on its app.
- Pending
- NHTSA's audit of Tesla's Cybercab, which has no steering wheel or pedals, and its recall review of Waymo cars passing stopped school buses.
- End of 2027
- Uber's goal of more than 2,000 driverless cars on its app, and its 'much larger commercial ramp' from 2028.
- Timing unconfirmed
- A House vote on the Motor Vehicle Modernization Act (H.R. 7389), which the Energy and Commerce Committee approved 48–1 in May; timing unconfirmed.
Quick questions
How many robotaxi rides are there in the US?
Waymo, the only operator at scale, passed 500,000 paid rides a week in the spring of 2026, Alphabet said, and now serves 15 metro areas. Tesla reports cumulative driverless miles, Zoox about 65 cars in Las Vegas, and Uber expects about 700 driverless cars on its app by the end of 2026; those figures aren't directly comparable.
Which industries lose if robotaxis spread?
The money tied to a human driver: drivers' pay, personal car insurance, crash repair and salvage, and, because the fleets are electric, petrol sales. Insurers such as Allstate and Progressive, Copart and fuel retailers such as Casey's name or face these effects in their own filings.
Are robotaxis safer than human drivers?
An independent IIHS study of Waymo's driverless cars found 68% lower police-reportable crash involvement per mile than human drivers in the same areas and years, across four cities from 2021 to 2024. Regulators are still reviewing both Waymo and Tesla, and the evidence covers Waymo's cars only.
+ 48 more
Accessed Nov 14, 2026: KUNC (Leigh Paterson): Waymo has arrived in Denver; here's what it's like to ride in one, Sep 25, 2026 · TechCrunch (Kirsten Korosec): Waymo's skyrocketing ridership in one chart, Mar 27, 2026 · Waymo: FAQ (cities served) · Fortune: Alphabet's Other Bets, Waymo's valuation and loan, Oct 30, 2026 · CNBC: Tesla Q3 2026 results and Musk on robotaxi revenue, Oct 21, 2026 · Casino.org: Zoox launches paid driverless rides in Las Vegas, Aug 11, 2026 · Minnesota Reformer: Minneapolis council fails to override veto on robotaxis, Oct 15, 2026 · Tesla: Q3 2026 update (SEC 8-K exhibit) · Electrek: Tesla's robotaxi zones and unsupervised FSD timing, Oct 21, 2026 · TechCrunch: Zoox clears federal hurdle for paid robotaxi service, Jul 30, 2026 · Uber: Q3 2026 prepared remarks · Uber: Q3 2026 results (SEC 8-K) · Lyft: Q3 2026 prepared remarks · TechCrunch: the price gap between Waymo and Uber is narrowing (Obi study), Jan 27, 2026 · AAA: Your Driving Costs 2026, Sep 15, 2026 · Waymo: safety impact data (through June 2026) · electrive: NHTSA reviews Waymo school-bus software recall, Nov 10, 2026 · TechCrunch: federal investigation into Tesla's Cybercab deployment, Sep 4, 2026 · Congressional Research Service: R48605, vehicle safety standards and exemptions, Jul 2025 · House Energy and Commerce Committee: advances 16 bills, May 21, 2026 · NBC Washington (Adam Tuss, Maggie More): tie vote defeats DC robotaxi bill, Nov 13, 2026 · Reason (Reem Ibrahim): DC's robotaxi bill terms and union opposition, Jul 15, 2026 (opinion outlet; bill terms and quotes only) · New York Fed: Household Debt and Credit, Q3 2026, Nov 10, 2026 · NADA: Data 2025 · NACS: US convenience-store sales, Apr 15, 2026 · NHTSA: Economic and Societal Impact of Motor Vehicle Crashes, 2019 (revised Feb 2023) · BLS: Occupational Outlook Handbook, taxi drivers and chauffeurs · Progressive: 2025 10-K · Allstate: 2025 10-K · Copart: fiscal 2026 10-K · Ally Financial: 2025 10-K · Avis Budget: 2025 10-K · Hertz: 2025 10-K · Casey's: fiscal 2026 10-K · Murphy USA: 2025 10-K · Lyft: 2025 10-K · Uber: 2025 10-K · O'Reilly Automotive: 2025 10-K · Tesla: 2025 10-K · NXP Semiconductors: 2025 10-K · onsemi: 2025 10-K · Nvidia: 10-Q for the quarter to Jul 26, 2026 · Mobileye: Q3 2026 results (SEC 8-K) · ChargePoint: fiscal 2026 10-K · Morgan Stanley: robotaxis, a $1 trillion opportunity, Jul 17, 2026 · Goldman Sachs Research: robotaxi market outlook, April 2026 · Donaldson and Hornbeck: Railroads and American Economic Growth (later author manuscript) · Olmstead and Rhode: Reshaping the Landscape, Journal of Economic History, 2001
Quoting this? You may quote short excerpts under our reuse policy. Please credit WhyMyStockMoved.com and link to this page.